The better we understand the theory, the better our decision-making becomes, without even having to think about it.
Marketing is the psychology behind selling more products or services.
By understanding more about consumption and the thought processes behind it for customers, the better we can please them. The more we understand about how businesses work, the more we can improve the processes. The more chances of success!
This article explores five theories and models that all business owners and marketers should understand.
The 80/20 rule, The Expectancy Disconfirmation Theory, The Product Life Cycle, Porter's Five Forces, and The Ansoff Matrix.
The 80/20 rule
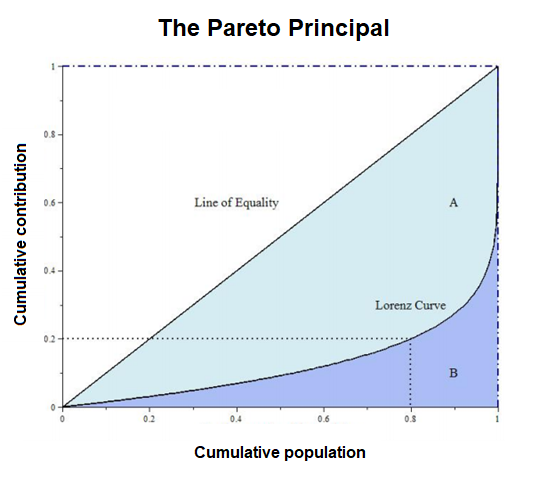
The 80/20 rule suggests that 80% of sales come from 20% of customers.
This theory dates to 1896, conceived by Italian economist Vilfredo Pareto, to explain wealth distribution when he noticed that 80% of Italy’s land was owned by approximately 20% of the country’s total population. It is thought that his initial observation was that 20% of the pea pods in his garden produced 80% of the peas!
“The Pareto Principle, which is sometimes called the 80/20 rule, states that a small proportion (e.g., 20 percent) of products in a market often generate a large proportion (e.g., 80 percent) of sales.” (Brynjolfsson, Hu & Simester, 2011).
The Pareto Principle
In the 1940s, Joseph M. Juran developed Pareto’s principle for use in strategic business management, naming it after Pareto — the Pareto Principle.
The underlying belief that the relationship between inputs and outputs is imbalanced and unequal, and for many phenomena, 80% of the output, consequences or effects are produced by 20% of the input or causes.
Representation of the Lorenz curve and the Concept of the 80–20 Rule (Dunford, 2014)

The rule transcends disciplines. It has since been applied for numerous purposes across the business, including in sales, marketing, economics, management and even computer sciences. 20% of athletes win 80% of the time, 20% of patients consume 80% of healthcare resources, and 20% of society holds 80% of the world’s wealth.
When applied to business, the underlying assumption is that 80% of the outcomes or results come from 20% of the effort. Other variations of this rule in a business context are:
- 80% of profits or revenue come from 20% of customers
- 80% of product sales from 20% of products
- 80% of sales from 20% of advertising
- 80% of customer complaints from 20% of customers
- 80% of sales from 20% of the sales team
However, this ‘rule’ is an observation, rather than a law or science. The two numbers don’t have to add to 100% — it is only used as a rule of thumb. It could be 80–20, 90–10, or even 90–20.
What we learn from this principle is to focus your efforts by working harder on the things that matter. That 20% of activities that provide 80% of results. The small stuff does not need to be sweated if it does change the overall result.
“It helps to realize that often the majority of results comes from a minority of inputs.” (Dunford, Su, and Tamang, 2014)
Individuals and businesses should focus most of their time and energy on accomplishing the tasks with the largest return on investment. They can do this through recognising how and where results are achieved. Similarly, the focus with sales should be on developing strong relationships with the best and most profitable clients.
The Expectancy Disconfirmation Theory
Expectation confirmation theory is a popular model used in services marketing for measuring customer satisfaction, introduced by Richard L. Oliver in 1977.
“An individual’s expectations are (1) confirmed when a product performs as expected, (2) negatively disconfirmed when the product performs more poorly than expected, and (3) positively disconfirmed when the product performs better than expected.” (Churchill & Surprenant, 1982)
The performance of a product or service is compared or measured against the customer’s expectations. Those expectations (or desire) of performance (or experience) are subjective to everyone, based on their prior knowledge of that product.
Performance becomes the mediator for satisfaction. The evaluated performance or experience influenced by previous experiences with that brand and consumers without prior expectations base their satisfaction judgements solely on the performance of the product.
The resultant difference between expectations and performance the basis for the disconfirmation of expectation (or desire) and can be positive or negative. Negative disconfirmation meaning the customer is left dissatisfied.
The theory has been applied across multiple fields to gain a better understanding of customer’s expectations and requirements, such as marketing and consumer behaviour, tourism, psychology, information technology, and the airline industry.
The expectancy disconfirmation theory involves four primary variables: expectations, perceived performance, disconfirmation of beliefs, and satisfaction.
The original expectancy disconfirmation model (Oliver, 1980)

Expectations
Consumers associate certain attributes or characteristics with a brand which is anticipated by that person. These expectations form the basis of comparison judgement — directly influence both perceptions of performance and disconfirmation of beliefs, and indirectly influence their post-purchase evaluations and feelings.
Expectations of a brand, product or service can be based on aspects such as feedback from friends and family, online reviews, marketing material, salespeople, and previous consumption experiences.
“First, customers have an initial expectation according to their previous experience with using a specific product or service. Second, new customers that don’t have a first-hand experience about performance of product or services.” (Elkhani, & Bakri, 2012)
Perceived Performance
After consumption, the consumer forms perceptions of the performance of a product, service or experience. These perceptions are influenced by their pre-purchase expectations, then influencing the disconfirmation judgement.
Aspects that performance is based on will be subjective depending on the product, service or experience — for example, for a mobile phone, one performance factor is how long the battery lasts.
Perceived performance can also indirectly influence customer satisfaction.
Disconfirmation
The judgments or evaluations that a person makes regarding a product, service or experience is called the disconfirmation of beliefs. These are made in comparison to the consumer’s original expectations.
If it outperforms expectations, the disconfirmation is positive. If it underperforms, the disconfirmation is negative. Thus, increasing or decreasing post-purchase satisfaction.
Disconfirmation mediates the relationship between performance and satisfaction.
Satisfaction
Post-purchase satisfaction is the extent of how pleased, contented or unhappy a person is after consumption.
The consumer’s disconfirmation of the perceived performance directly influences their satisfaction, satisfaction also indirectly influenced by both expectations and perceived performance through the mediating effects of disconfirmation.
How satisfied or dissatisfied a consumer has influenced their post-purchase behaviour. This includes their attitude towards the brand, their loyalty and whether they repeat purchase, and their word of mouth intent. If people are happy, they are more likely to purchase again and tell friends about their positive experience.
The Product Life Cycle
The lifecycle of a product is the length of time it is on the market. Beginning when it is introduced into the market and lasting until it is taken off the shelves.
When a product is introduced to the market if successful, demand increases. Then, as new products enter the market and become successful, they push more dated ones from the market, replacing them.
This concept is commonly used in marketing management, helping inform the decision-making of business, such as pricing, when to increase spending on advertising, expand to new markets, redesign packaging and cost-cutting.
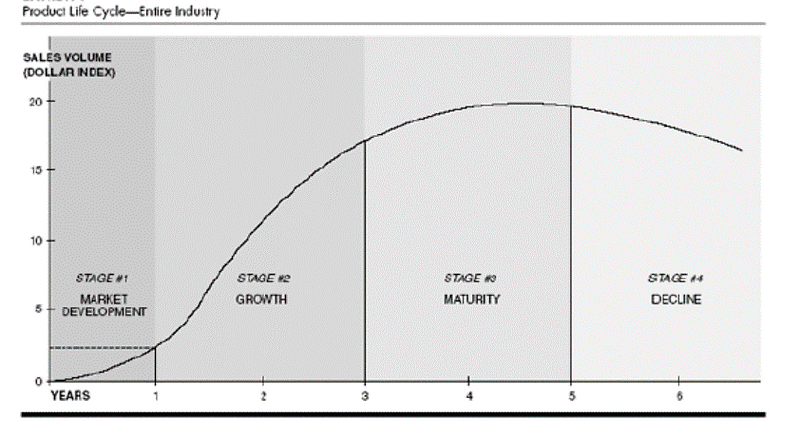
This life cycle has four or five stages, depending on the source. The original model used four — market development, growth, maturity, and decline.
Other versions have added a fifth, introduction, which is the second phase.
Where a product is in its life cycle impacts how it is marketed. New products have more informational marketing, whilst mature products have marketing which differentiates it from the alternatives.
Large manufacturers often have products each in various stages of the product life cycle at any given time.
Each stage has unique costs, opportunities and risks and individual products have different lengths of time when they remain at any of the life cycle stages.
The Product Lifecycle (Levitt, 1965)

Stage 1 — Market Development & Introduction
When a new product is brought to market, typically there will be some research and development behind it, to make sure it is fit for market and proven demand for it.
Before launched into the market, costs accumulate with no sales. It could take years and a large investment of capital to develop and test some products.
Next comes the introduction to the market, where the goal is to build awareness of the product.
Marketing costs here are high. To reach out to potential customers, substantial investment in advertising is made. Marketing focuses on making consumers aware of the product and its benefits.
Pricing can sometimes be higher to recover costs associated with product development.
“Unit sales are low in introduction, because few consumers are aware of the new good (or service). With consumer recognition and acceptance, unit sales begin to increase… the start of the growth stage. …As more competitors enter the industry and the market becomes smaller… Unit sales reach a plateau, and the product is in the maturity stage.” (Rink, & Swan 1979)
Stage 2 — Growth
If a product launch is successful and customers accept the product, it enters the market growth phase as demand increases. The size of the total market inflates, sometimes called the ‘Take-off Stage’, as the company aims to increase market share. Production, distribution and availability are expanded.
If innovation on a product is high and there’s little competition, pricing can remain high. Marketing is aimed at a broad audience as demand and profits are both increasing.
Stage 3 — Maturity
As demand and sales levels off, a product enters the market maturity stage. Sales are the highest at this phase and the costs of production decline as manufacturing becomes more efficient. Marketing costs are also reduced.
As more options become available to customers, as competition increases.
Firms may look at updated product features to stay ahead of competitors and maintain market share. Prices also tend to decline to stay competitive.
Stage 4 — Decline
When products start to lose their appeal with consumers and sales reduce, they enter the market decline phase. Market share is lost, often because of increased competition as new products enter the market, with other firms trying to emulate their success. These can be more suited towards customer needs with the advancement in technology for example or lower prices.
Firms can choose to discontinue the product and remove it from the market, find new product uses to position it differently in the market, or perhaps by exporting the product into new markets.
In any case, the firm by now should be into the research and development phase for their next product.
Porter’s Five Forces
To help better understand and assess the competitiveness of an industry, Porter’s Five Forces model is commonly used.
“According to Porter (1980), the collective strength of the forces determines the ultimate profit potential in the industry.” (Dobbs, 2014)
Michael E. Porter from the Harvard Business School created the model in 1979. He believed that by understanding the level of competitive intensity of an industry, it will identify the attractiveness of entering that market.
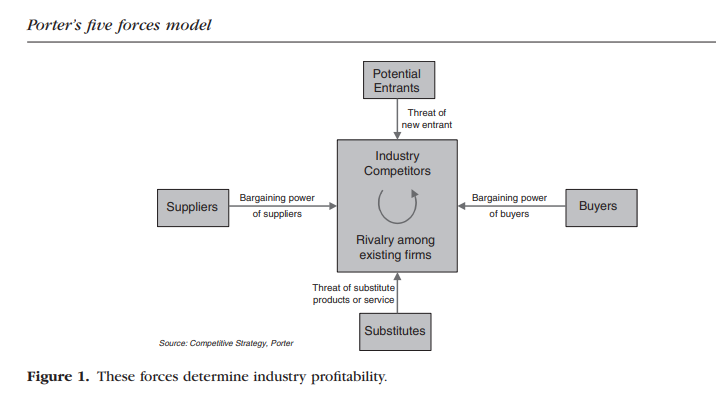
Porter’s 5 Forces (1979)

Attractive markets have few competitors or there might be a gap in the market that a business can target with strategic positioning.
Emphasising the importance of identifying imperfect markets offering more opportunities that are profitable, the model provides useful information to direct a businesses’ strategic approach and marketing.
If they are an existing firm and want to a better understanding of the current market, they can analyse their current position and plan their future direction by aligning it with their strengths and addressing their weaknesses. If a new business or entering a new industry, they can highlight how they are most likely to succeed.
“…Account for long-term variances in the economic returns of one industry versus another… distilling the complex micro-economic literature into five explanatory or causal variables to explain superior and inferior performance.” (Grundy, 2006)
Applying ‘systems thinking’, the model simplifies several complicated microeconomic theories into just five components that impact a market’s long-term profitability:
- The bargaining power of the buyers
- The threat of new entrants
- Competitive rivalry
- Threat of substitution
- Supplier power
Competitive rivalry is the central box of the model, a function of the other four forces. The importance of negotiating power and bargaining arrangements is identified — this focus on external factors more prominent than in other market analysis theories such as a SWOT analysis.
Buyer Power
In certain marketplaces, buyers have more power and can apply pressure on companies to lower prices. If competition is high and the customer has many choices, they have a higher power. Buyers can also join to have a stronger influence on changing the behaviour of a firm. For example, for ethical reasons consumers might boycott a brand.
The Threat of New Entrants
What is the likelihood of new entries in the market? If an industry is perceived as attractive, increased competition is highly likely.
If too many new entrants enter that market, its potential profitability will decline. If a marketplace has few but immensely powerful players in it, they will try and make it as difficult as possible for new companies to enter that market. Other barriers to entering that market also need to be considered to do exit barriers. Entry barriers include government policies, patents and technology.
Competitive Rivalry
The current competition within the marketplace is obviously an important consideration. Understanding competitive rivalry uncovers how many competitors there are and how much they spend on marketing, what competitive advantages they have (if any), the level of continuous innovation and any differences in quality between players.
Threat of Substitution
Customers might be able to choose to substitute a product or service with another. Not to a competitor’s product from the same market — but instead, switching product categories altogether. For example, a person might stop purchasing fast food and instead purchase pre-made frozen healthy meals. The more substitute items there are, the more likely customers are to be drawn to an alternative product.
Supplier Power
Firms must research and consider different alternatives for supply in the market. Raw materials for example can vary a great deal in terms of price, quality and whether. Have the right supplier is critical. How much power does that supplier have? How many competitors do they have? Will their price be consistent or are they likely to increase it? The fewer suppliers there are, the more power they have. The cost of switching suppliers and the ease of distribution is also a consideration.
The Ansoff Matrix
A popular framework for decision-making about growth and expansion strategies is the Ansoff Matrix. Developed by H. Igor Ansoff, it was first published in the Harvard Business Review in 1957.
His perspective was that firm must continuously grow and change to create a competitive advantage.
“Growth is essential to run a business for profit and, to study the growth, Ansoff Matrix is a planning technique used for deliberate judgment about firm growth through product and market extension networks.” (Hussain, Khattak, Rizwan, & Latif, 2013)
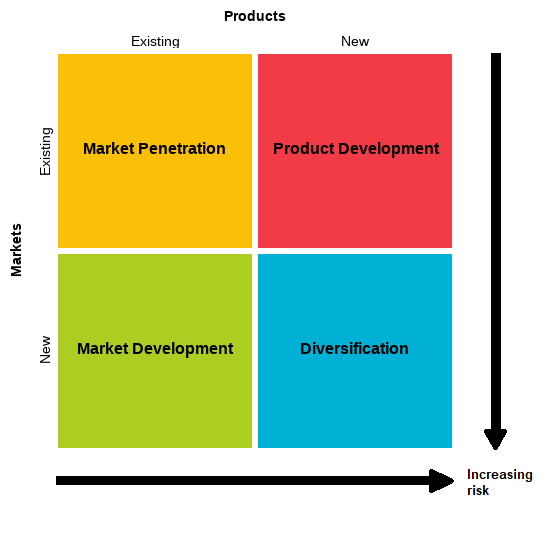
By analysing their market through the four components of the matrix: market penetration, market development, product development and diversification; firms identify strategic alternatives to accomplish their growth objectives.
The Ansoff Matrix (1957)

Also referred to as the Product/Market Expansion Grid, the Ansoff Matrix also helps businesses to better understand the risks of different growth strategies.
Of the four strategies, market penetration hosts less risk and diversification the most risk.
Market Penetration
Increasing the sales of existing products to an existing market is a market penetration strategy. Firms aim to increase their market share, which can be achieved in the following ways:
- Prices are decreased to attract new customers
- Promotion and distribution increased
- A competitor in the same marketplace is acquired
Often brands new to a marketplace engage a market penetration strategy through offering lower introductory prices.
Product Development
The focus of the next strategy is on developing and introducing new products to existing markets. This involves extensive research and development by a firm to expand on its product range. The strategy is usually used if a firm has a strong understanding of their current market, giving them the ability to meet the needs of the existing market by providing innovative solutions.
Characteristics of product development include:
- Investing in R&D to develop new products to cater to the existing market
- Acquiring a competitor’s product and merging resources to create a new product that better meets the need of the existing market
- Forming strategic partnerships with other firms to gain access to each partner’s distribution channels or brand
An example of this BMW and other premium automobile manufacturers adding an electric sports car model to their fleet of vehicles, to compete in the electric sports car market with Tesla and increasing consumer demand for electric vehicles.
Market Development
Entering a new market with existing products is called a market development strategy. This could be by expanding into new geographic areas, either domestically or internationally, or focusing on new customer segments (groups of buyers with similar needs).
If a company holds a competitive advantage with a certain technology, for example, it can be easily transferred into another marketplace where similar consumer behaviour characteristics with their own market, should mean it is a profitable strategy.
For example, often companies in New Zealand will expand into neighbouring Australia if they are highly successful. Australia and New Zealand share similar consumer behaviour across many segments, meaning the product or service can remain virtually unchanged.
Diversification
Using the introduction of new products as a strategy to enter a new market is called diversification. This is the riskiest strategy in the Ansoff Matrix, as both market and product development are required. But it also offers the most potential for profitability, by accessing consumer spending in a market they previously had no access to.
There are two types of diversification: related diversification and unrelated diversification.
Related diversification means there is an overlap between a business and the new product or market. For example, a company that produces plastic lunchboxes might start producing plastic bumpers for automobiles.
Unrelated diversification is where there is no overlap between the core business and the new product or market. For example, if that same company producing plastic lunchboxes was to start manufacturing steel framing for construction.
Summary
That is the conclusion of the five theories & models that all marketers and business owners should understand.
That was a fair bit of information, I hope you can digest it all and learnt something that will benefit you and/or your business.
Marketers and business owners, in general, should always be looking for opportunities to increase their understanding of how customers think and how business works.
I hope you enjoyed the article and learnt something new.
This content was originally posted on the BYB Marketing Blog: https://brandyourselfbetter.com/blog/post/164457/5-theories-or-models-that-every-serious-marketer-should-know

No comments:
Post a Comment